Hydrologické předpovědi jsou důležitým nástrojem pro plánování a ochranu před povodněmi, suchem či jinými vodními jevy. Moderní předpovědní modely často využívají pravděpodobnostní přístup, kdy výsledky nejsou prezentovány jako jediná hodnota (dosud to byla pouze deterministická předpověď, v grafu tmavě modrá čára), ale jako rozmezí pravděpodobnosti, které vyjadřují míru nejistoty v předpovědi. Tento dokument vám pomůže pochopit, jak číst a interpretovat plošné grafy pravděpodobnostní hydrologické předpovědi, ve kterých jsou úrovně pravděpodobností rozděleny do pásem lišících se podle pravděpodobností výskytu předpovídaného jevu.
Pravděpodobnostní hydrologická předpověď je výsledkem hydrologického modelu, který simuluje 17 variant vývoje hydrologické situace na základě meteorologického modelu ALADIN-LAEF, který předpovídá 17 scénářů vývoje počasí (např. srážek a teplot) v následujících 66 hodinách. Výsledkem pravděpodobnostní hydrologické předpovědi je místo jedné konkrétní hodnoty (deterministická předpověď – modrá čára) rozmezí výsledků, které jsou rozděleny podle pravděpodobnosti jejich výskytu (graf 1).
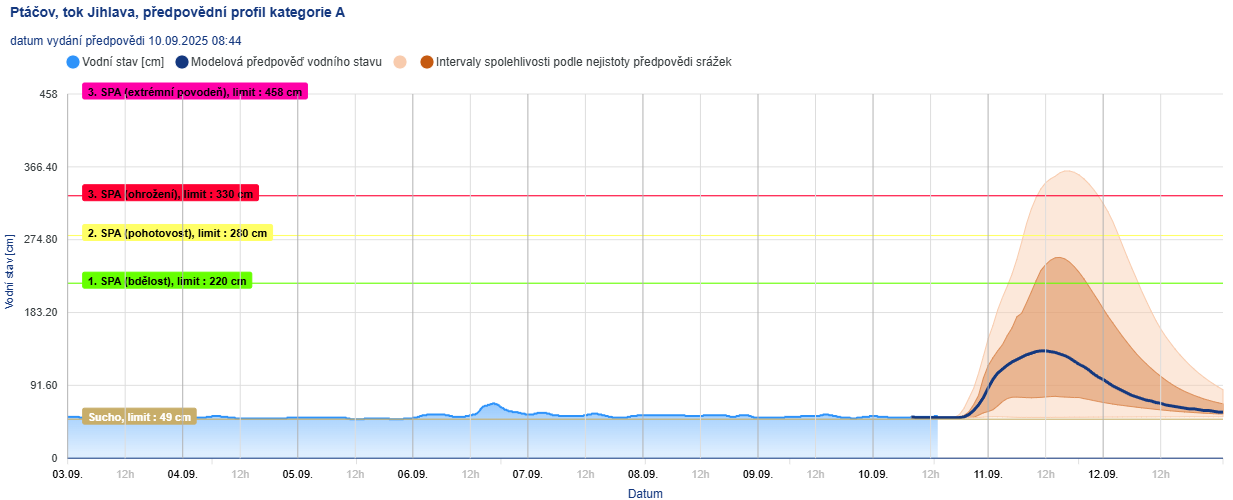
Graf 1: Ukázka pravděpodobnostní hydrologické modelové předpovědi v profilu Ptáčov na Jihlavě, deterministická předpověď je znázorněna tmavě modrou čárou
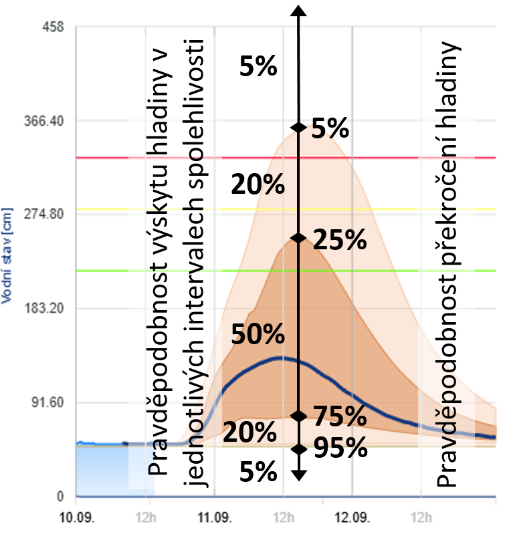
Plošný graf (hnědé plochy) zobrazuje barevně odlišené oblasti, které reprezentují různé úrovně pravděpodobnosti dosažení určitého průtoku/vodního stavu. V případě prezentace hydrologické předpovědi jsou použity dva intervaly:
5–25 % (světle hnědá barva): Nižší pravděpodobnost – událost je méně pravděpodobná, ale vyloučit ji nelze. V případě 17 běhů modelu ALADIN-LAEF je tato pravděpodobnost reprezentována 4 běhy hydrologického modelu, které dosahují největší, či nejmenší hodnoty průtoků (vodních stavů) v následujících 66 hodinách. Tzn. že největší (horní okraj světle hnědého plošného grafu), či nejmenší (dolní okraj světle hnědého plošného grafu) reprezentuje pouze jeden běh hydrologického modelu, pravděpodobnost výskytu tohoto scénáře je tedy ca 5 %.
25–75 % (tmavě hnědá barva): Vyšší pravděpodobnost – výskyt události je vysoce pravděpodobný. Z hlediska jednotlivých běhů hydrologického modelu generovaných ze vstupů ALADIN-LAEF ji reprezentuje 9 středních běhů.
Pokud je oblast v grafu označena jako 5–25 %, znamená to, že model předpovídá danou hydrologickou událost menším počtu simulací (1–4 běhy). Jinými slovy, existuje jen omezená šance, že daná událost nastane. V praxi to znamená, že riziko je sice nižší, ale nemělo by být zcela ignorováno, zejména pokud by případná událost měla vážné následky.
25–75 %: Vyšší pravděpodobnost
Vyšší pravděpodobnost znamená, že model u poloviny (9) simulací danou událost předpovídá. V takovém případě je třeba jednat – například zahájit opatření proti povodním, informovat veřejnost nebo aktivovat krizové plány.
Pravděpodobnostní hydrologické předpovědi poskytují důležité informace pro rozhodování v krizových situacích. Plošné grafy s rozdělením do pásem pravděpodobnosti umožňují rychlou orientaci v míře rizika na různých místech. Správná interpretace těchto grafů je klíčová pro efektivní plánování a ochranu před vodními extrémy.
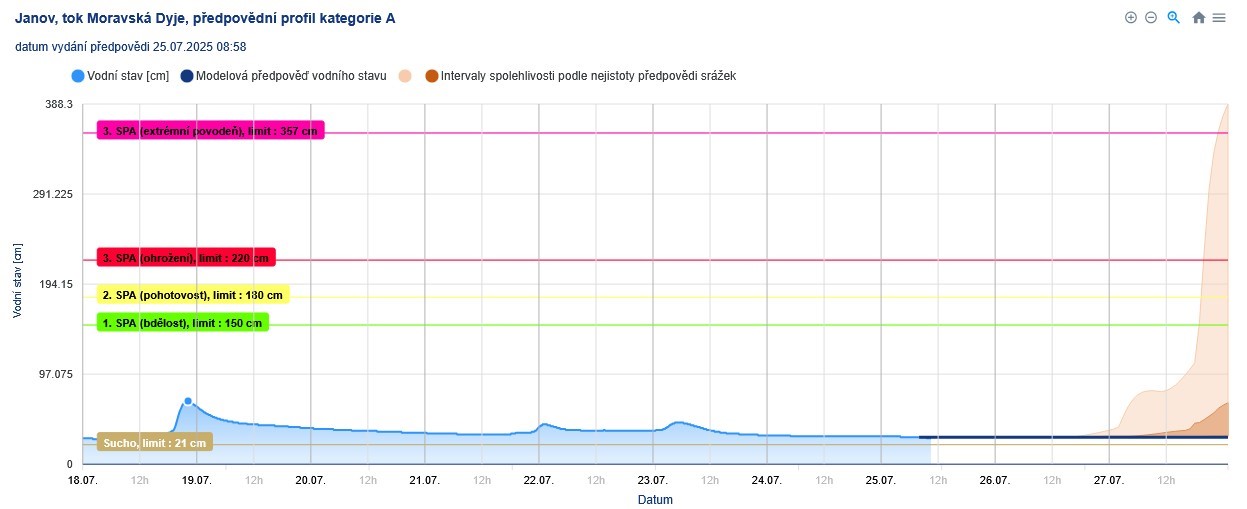
Na vybraných reálných předpovědích je znázorněna rozdílná míra nejistoty pravděpodobnostních předpovědí. První příklad znázorňuje předpověď z 25. července 2025 v profilu Janov na Moravské Dyji. Vysoká míra nejistoty předpovědi na 27. července byla zapříčiněna očekávaným výskytem bouřek s přívalovými srážkami. Jedna ze 17 variant vývoje dokonce předpokládala i překročení hladiny na úrovni 50letého průtoku. Z vybraného případu je ovšem taky patrné, že pravděpodobnost tohoto vývoje je pouze 5 %, naopak s vysokou pravděpodobností (75 %) se očekává úroveň hladiny 27. července výrazně pod úrovní 1. SPA (graf 2).
Graf 2: Ukázka pravděpodobnostní hydrologické modelové předpovědi z 25. 7. 2025 v profilu Janov na Moravské Dyji, deterministická předpověď je znázorněna tmavě modrou čárou
Meteorologický model ALADIN-LAEF predikoval v jednom ze 17 běhů na 27. července výskyt výrazných bouřek doprovázených přívalovými srážkami právě na povodí Moravské Dyje. Ostatních 16 běhů tak výrazné srážky neočekávaly.
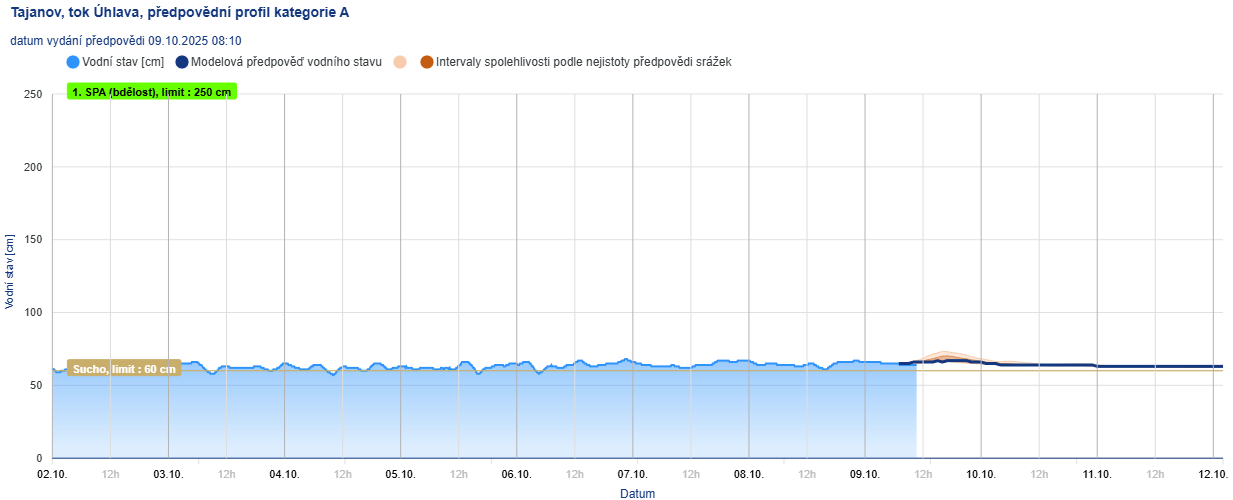
Druhým příkladem je předpověď z 9. října 2025 v profilu Tajanov na Úhlavě (graf 3). Nízká míra nejistoty na celé období předpovědi je způsobena očekávaným výskytem pouze mírných srážek frontálního původu, v důsledku toho jsou znázorněné pole pravděpodobností dosažení rozdílných úrovní vodních hladin velmi omezené.
Graf 3: Ukázka pravděpodobnostní hydrologické modelové předpovědi z 9. 10. 2025 v profilu Tajanov na Úhlavě, deterministická předpověď je znázorněna tmavě modrou čárou
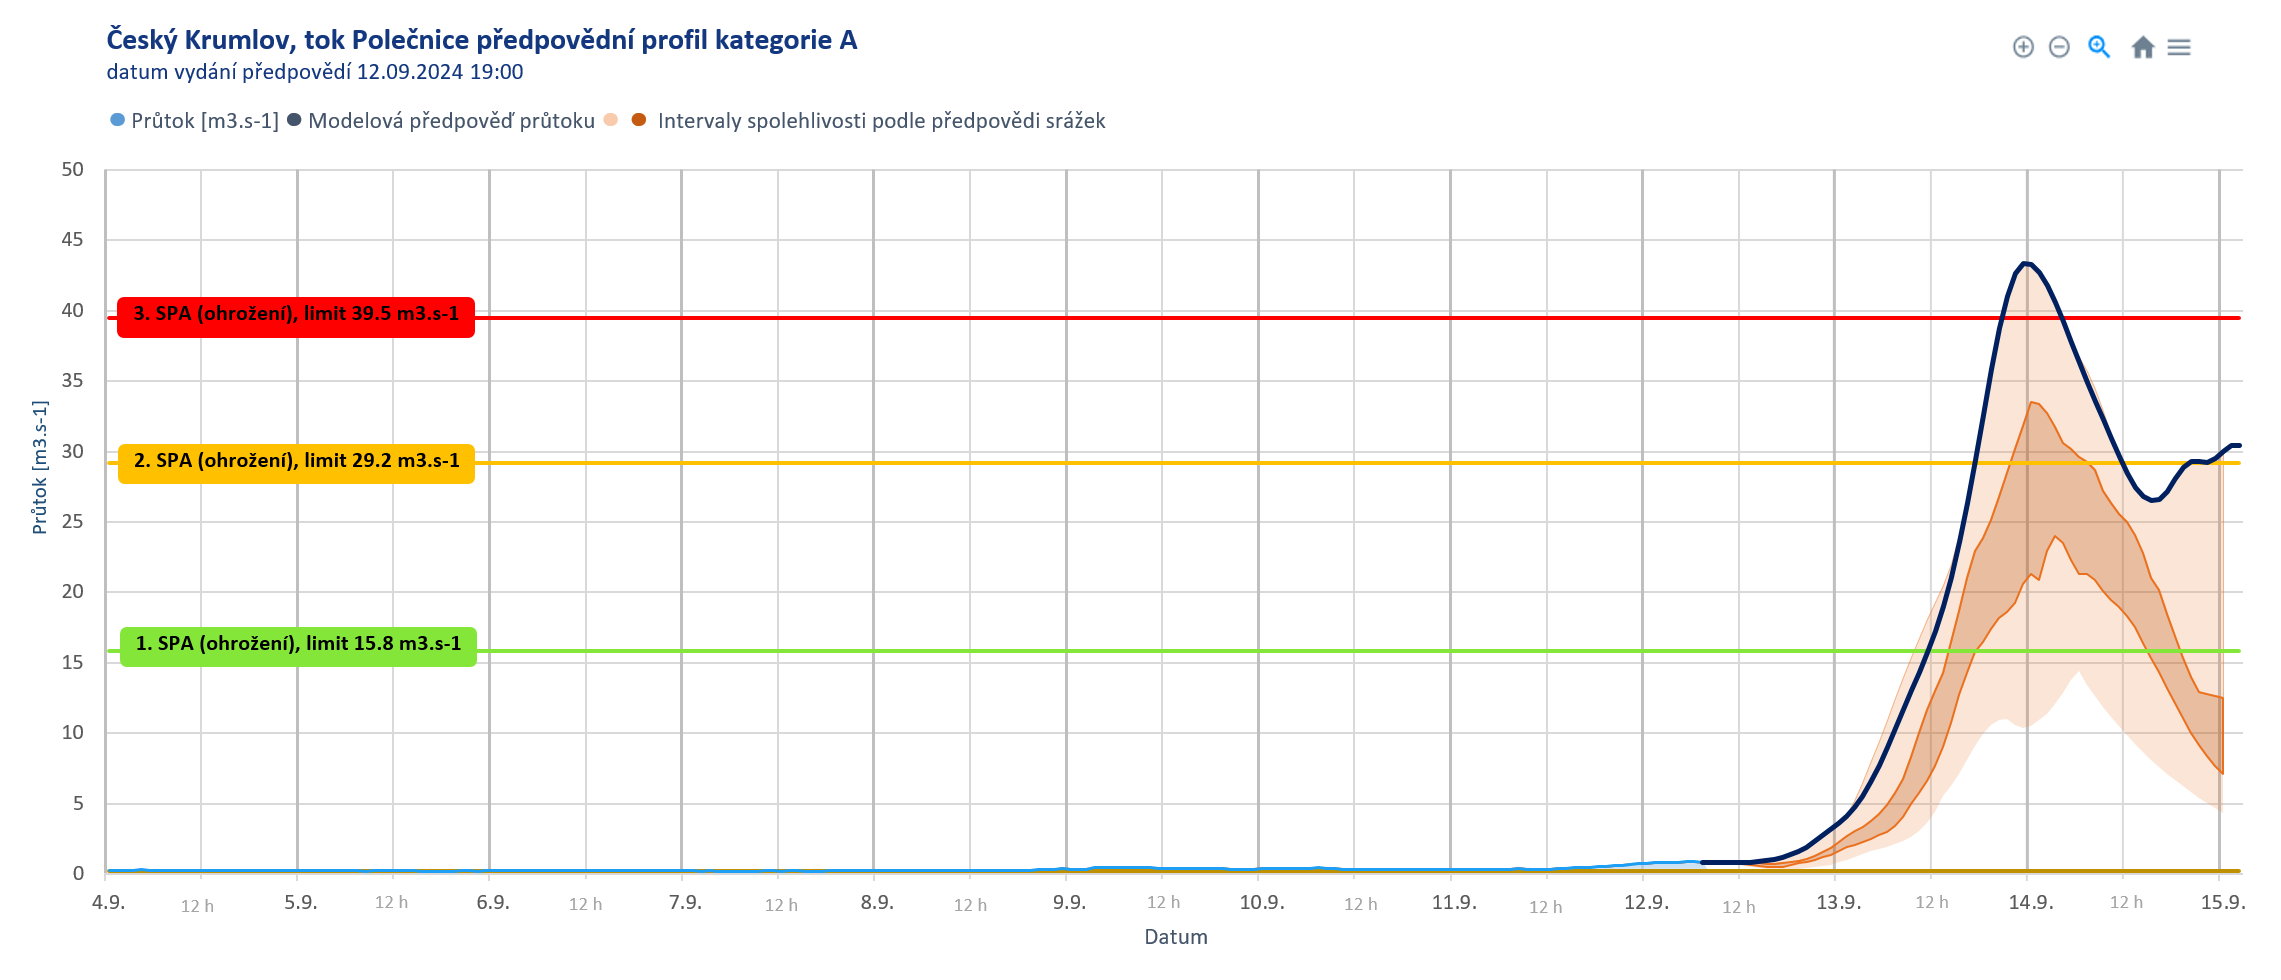
Dalším příkladem (graf 4) je předpověď z 12. září 2024, kdy se všechny varianty předpovědí průtoků shodují, že lze očekávat výrazný vzestup hladin nad úroveň SPA. Horní okraj tmavšího intervalu překračuje 2. SPA a proto i riziko překročení toho stupně je vyšší. Deterministická předpověď počítaná z modelu ALADIN-CZ (v grafu jako Modelová předpověď průtoku - modrá čára) je nejhorším scénářem a proto se deterministická předpověď pohybuje na horním okraji intervalu spolehlivosti. V této konkrétní situaci byl pozorovaný průtoku 55 m3.s-1, takže je nutné počítat i s malým rizikem, že skutečnost bude mimo interval spolehlivosti.
Graf 4: Ukázka pravděpodobnostní hydrologické modelové předpovědi z 12. 9. 2024 v profilu Český Krumlov na Polečnici, deterministická předpověď je znázorněna tmavě modrou čárou
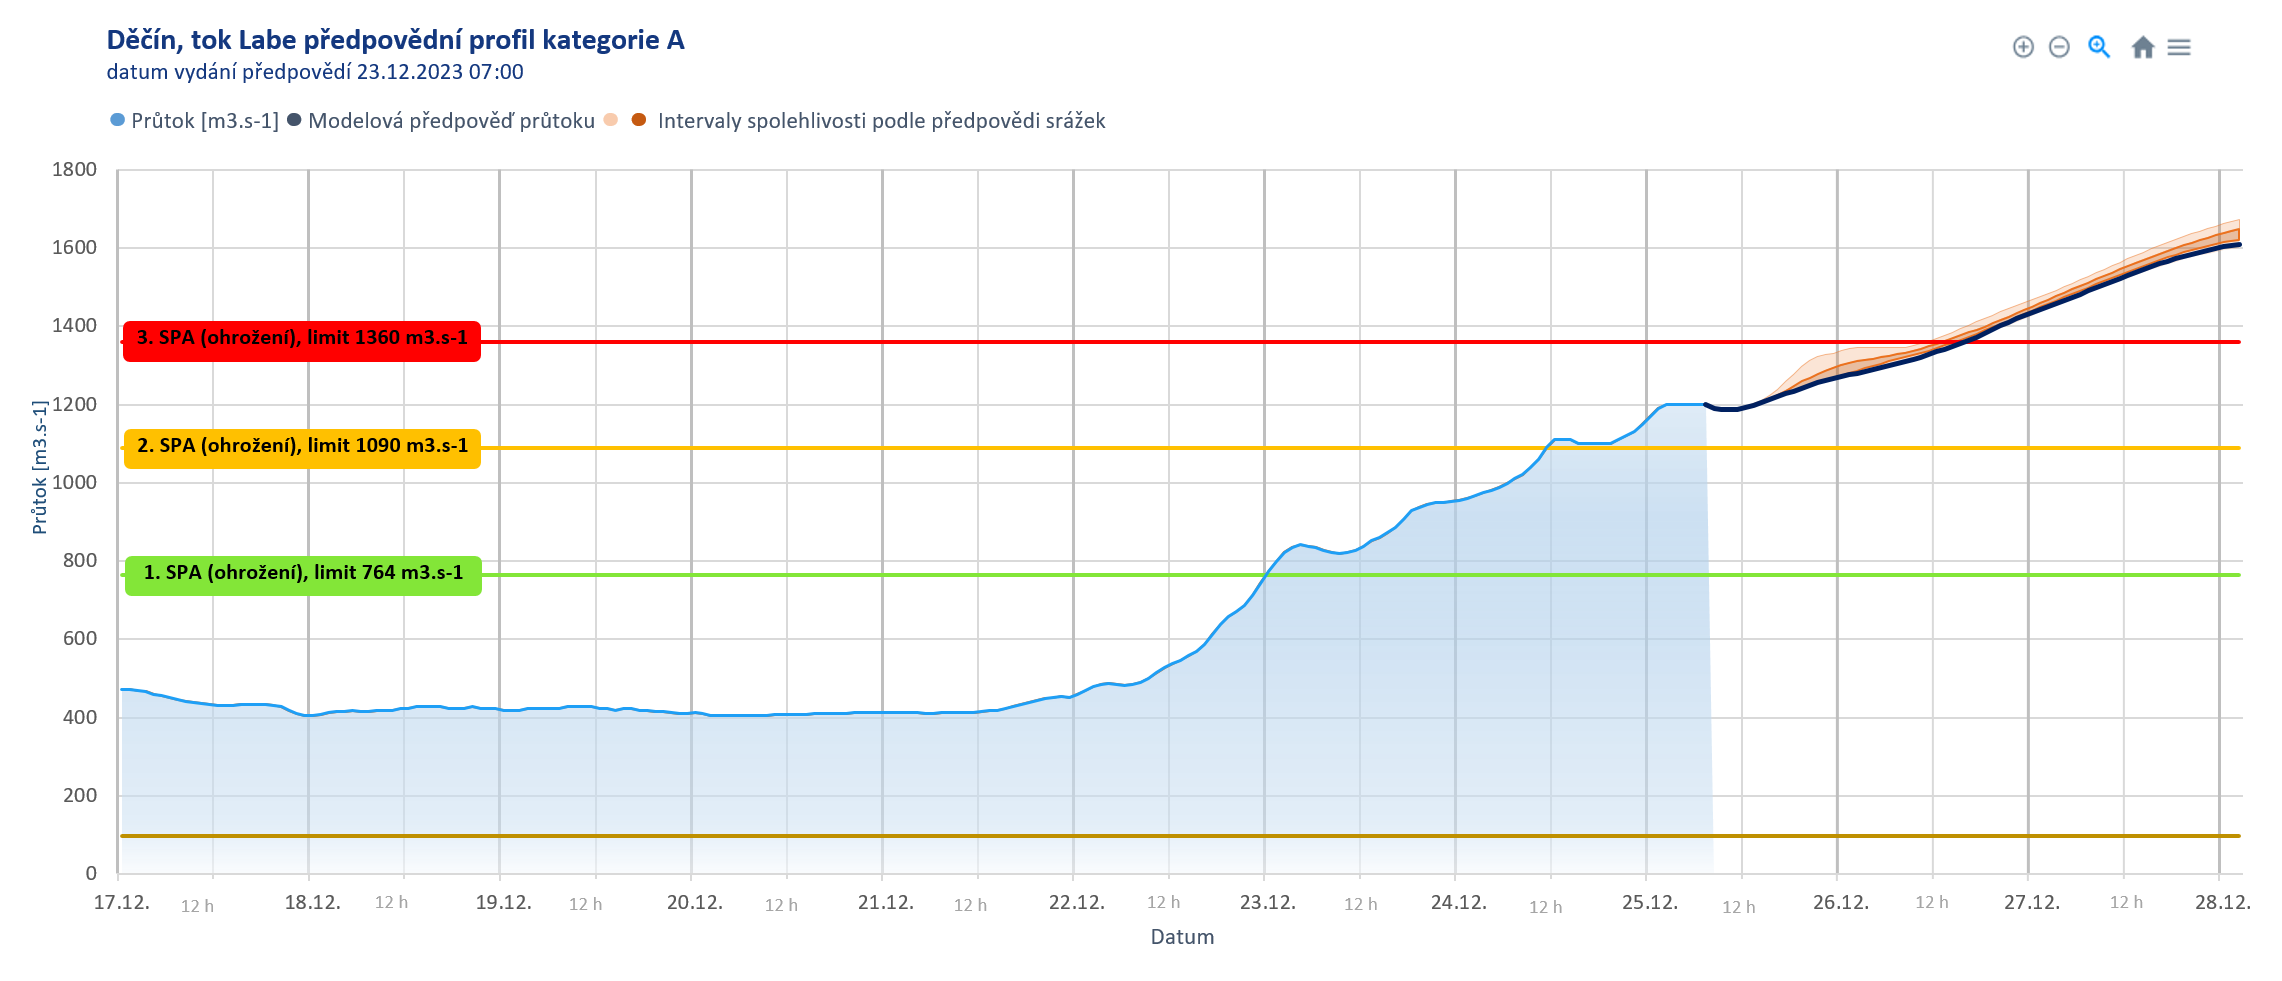
Poslední příkladem je předpověď z 25. prosince 2024, kdy intervaly spolehlivosti jsou velmi úzké, i když se průtok stále zvyšuje. Jedná se o předpověď pro Děčín na Labi (graf 5), tedy pro dolní úsek velké řeky, kde hladina stoupá zpravidla až v době, kdy už deště skončily a žádné srážky se nečekají. Na těchto velkých řekách bývají hydrologické předpovědi relativně spolehlivé, ale přesto vliv dalších nejistot jako jsou například přesnost měření nebo výpočet postupu a transformace vody korytem způsobí, že skutečný průtok bude velmi pravděpodobně mírně mimo uvedený interval.
Graf 5: Ukázka pravděpodobnostní hydrologické modelové předpovědi z 24. 12. 2024 v profilu Děčín na Labi, deterministická předpověď je znázorněna tmavě modrou čárou